MMIS monthly malaria situation
The National Center for Vector Borne Diseases Control (NCVBDC) publishes a Monthly Malaria Situation report for each category of States/UTs. The October 2023 Category II report has 19 pages. Pages 3-4 summarise the category; then each of six States (Chhattisgarh, Jharkhand, Maharashtra, Meghalaya, Odisha, West Bengal) gets two pages. Each of those pages holds two trend graphs, and under each graph is a small table: a row of months, then the Current Year and 3 Year Average values the graph plots. The four indicators are BSE (blood slides examined), TPC (total positive cases), TPR (positivity rate: TPC per 100 slides) and PF (Plasmodium falciparum cases).
The table names no State or indicator; the graph’s title above it names both: GRAPH 2: MONTH WISE TREND OF TPC IN CHHATTISGARH.
The files are in pdfexorcist/recipes/mmis_malaria/: recipe.toml and mmis.py. The fixture is pages 3-4, 7-8 and 17-18 of the October 2023 report (Category II, Chhattisgarh and West Bengal), in tests/fixtures/mmis/.
The recipe
name = "MMIS monthly malaria situation"

[pages]
match = 'GRAPH \d: MONTH WISE TREND'

[engines]
ocr = false

[parser]
type = "custom"
function = "mmis.py:parse"
key = ["page", "block", "series", "month"]

# TPR is TPC per 100 slides examined, printed to 2 decimals
[[checks]]
function = "mmis.py:tpr"

[[checks]]
function = "mmis.py:pf_within_tpc"

# a table pasted under the wrong graph
[[checks]]
function = "mmis.py:label_matches_title"

[output]
layout = "table"
rows = ["area", "indicator", "series"]
columns = "month"
format = "csv"
match keeps the graph pages and skips the cover, index, district list, action points and indicator glossary.
The key leaves out the area and indicator. camelot reads each table without the title above it, so a key holding them would leave camelot out of every vote. A cell is keyed instead by its graph’s place on the page (block 1 or 2, counted by the month row, which every engine reads), the series and the month. The area, the indicator and the full title are extra columns: each takes the reading most engines agree on, here the four that see the title. printed is the indicator named in the row label.
Run it
pdfexorcist extract https://ncvbdc.mohfw.gov.in/Doc/MMIS/October-2023/MMISReport-Category-II-October-2023.pdf --recipe pdfexorcist/recipes/mmis_malaria/recipe.toml -o mmis.csv
On the whole report, 568 cells across pages 3-4 and 7-18 all agree. On the fixture:
pdfexorcist extract tests/fixtures/mmis/mmis_cat2_2023-10_p3-4_7-8_17-18.pdf --recipe pdfexorcist/recipes/mmis_malaria/recipe.toml -o mmis.csv
✓ pdftotext   232 readings  0.0s
✓ pdfplumber  232 readings  0.2s
✓ pymupdf     232 readings  0.0s
✓ camelot     232 readings  1.1s
✓ pdfium      232 readings  0.0s

✓  Agreed         232  100.0% of cells
   Unresolved       0
✗  Failed checks   21  agreed values break a rule
    ✗ row label matches the graph title: 21 cells

   Wrote   mmis.csv  24 rows, table layout
area,indicator,series,printed,graph,Jan,Feb,Mar,...,Sep,Oct,Nov,Dec
CATEGORY II STATES/UTs,BSE,current,BSE,GRAPH 1: MONTH WISE TREND OF BSE IN CATEGORY II STATES/UTs,3549034,3811621,3909330,...,4230022,,,
CATEGORY II STATES/UTs,BSE,avg3,BSE,GRAPH 1: ...,2960192,3029955,3196985,...,3552250,3437172,3445055,3594700
...
CHHATTISGARH,TPC,current,TPC,GRAPH 2: ...,2996,2542,1865,...,2677,,,
CHHATTISGARH,PF,current,TPC,GRAPH 4: ...,2996,2542,1865,...,2677,,,
...
WEST BENGAL,PF,current,PF,GRAPH 4: ...,122,56,66,82,,,,,,,,
The current year runs to September (to April in West Bengal); the October cells are empty, as printed.
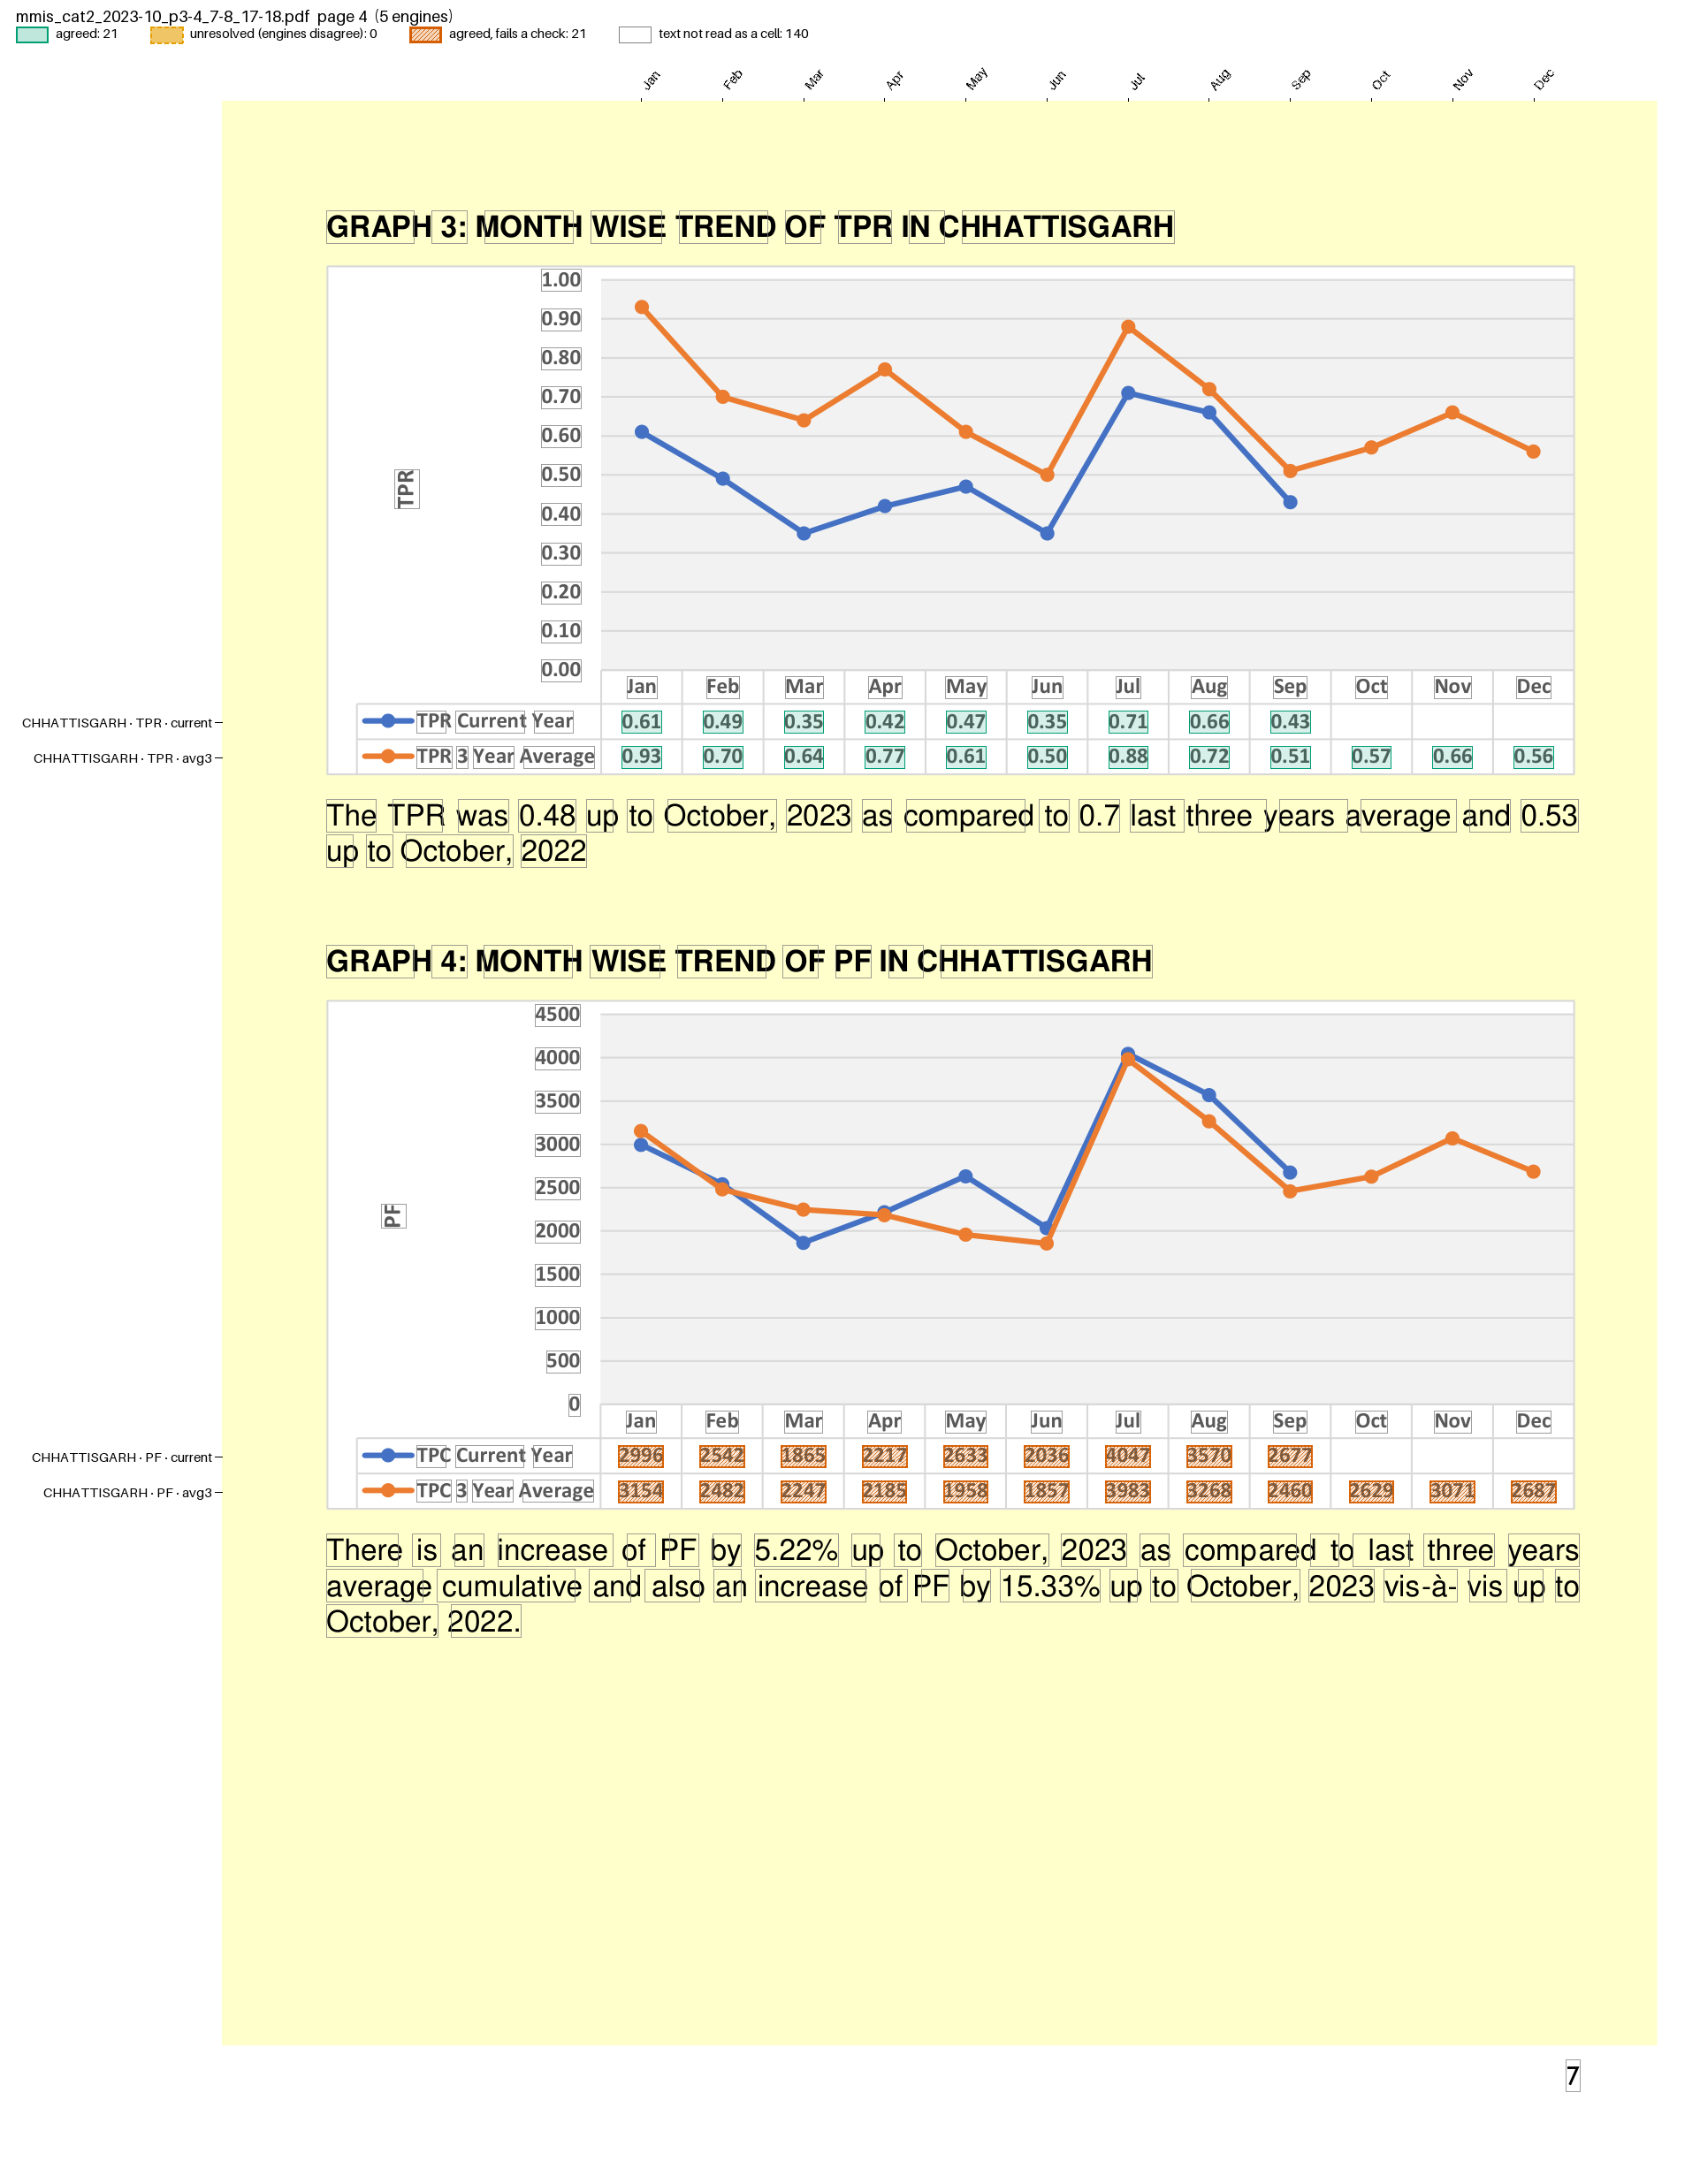
pdfexorcist show tests/fixtures/mmis/mmis_cat2_2023-10_p3-4_7-8_17-18.pdf --recipe pdfexorcist/recipes/mmis_malaria/recipe.toml --page 4 -o page.png draws what the recipe reads on Chhattisgarh’s second page:
The parser
parse() in mmis.py, in outline (pseudocode):
def parse(pages):
    for page_no, lines in pages:
        for line in lines:
            "GRAPH n: MONTH WISE TREND OF <indicator> IN <area>"  -> the next graph's title
            "Jan Feb ... Dec"                                    -> a new block; it takes the title
            "<BSE|TPC|TPR|PF> <Current Year|3 Year Average>" then up to 12 numbers
                -> yield {"page", "block", "series", "month": Jan, Feb, ..., "value",
                          "area", "indicator" (from the title), "printed" (from the label), "graph"}
Values are left-aligned under the months, and only trailing months are ever blank, so the n-th value is the n-th month. The y-axis ticks (4500000, BSE 300000) do not match a row label and are skipped.
The checks
TPR = 100 × TPC / BSE, by area, series and month, which ties together the tables of three graphs across two pages. The 3-year averages are printed as whole numbers, so for them TPC and BSE may each be off by half: Meghalaya’s August average prints 0.39, while 100 × 160 / 41562 = 0.385. Current-year counts are exact and get no slack.
PF ≤ TPC: falciparum cases are a subset of all positive cases.
Row label matches the graph title. On page 7 of the report (page 4 of the fixture), Chhattisgarh’s
GRAPH 4: ... TREND OF PFhas the TPC table under it: rows labelledTPC Current YearandTPC 3 Year Average, with the TPC graph’s numbers, and the line plotted from them. The text below the graph gives PF changes of 5.22% and 15.33%, which these numbers do not support. The 21 cells are agreed, kept as printed, and fail the check, so the run exits with code 1 and lists them inmmis.review.csv.
tests/test_mmis_malaria.py runs the recipe on the fixture and compares every value with tests/fixtures/mmis/expected.csv, which make_fixtures.py builds from pdftotext -layout independently of the parser.